REVIEW
of
FINANCE -
November, 2018
59
APECijt: A binary variable that takes value 0 if the
Philippines and importing country are not members
of APEC in year t; value 1 if the Philippines and
importing country are members of APEC in year t.
LANGij: A binary variable that takes value 0 if the
Philippines and importing country do not use English
as mutual language; value 1 if the Philippines and
importing country use English as mutual language.
βi: Coefficients showing the impact magnitude of
factor i in the model.
uijt: A random error.
Analysis figures are collected from statistics of
97 countries for the period 1997-2013 (Table 1).
TABLE 1: DATA SOURCES FOR THE VARIABLES USED
IN GRAVITY MODEL
Variable
Source
EXPORT (Export turnover)
World Bank (2018a)
GDP (Gross Domestic
Product)
World Bank (2018b)
POP (Population)
World Bank (2018b)
CAP (Foreign Capital)
Asian Development Bank
INF (Inflation)
DIS (Geographic distance)
EDIS (Economic distance)
World Bank (2018b)
OPEN (Economic Openness)
Measured from the data and
figures of World Bank (2018b)
APEC (Binary variable APEC)
LANG (Mutual language)
/
ngon-ngu-cua-cac-
nuoc-tren-the-gioi/
Data source: Collected and summarized by the authors
Research findings
Overview of commodity export activities of the
Philippines
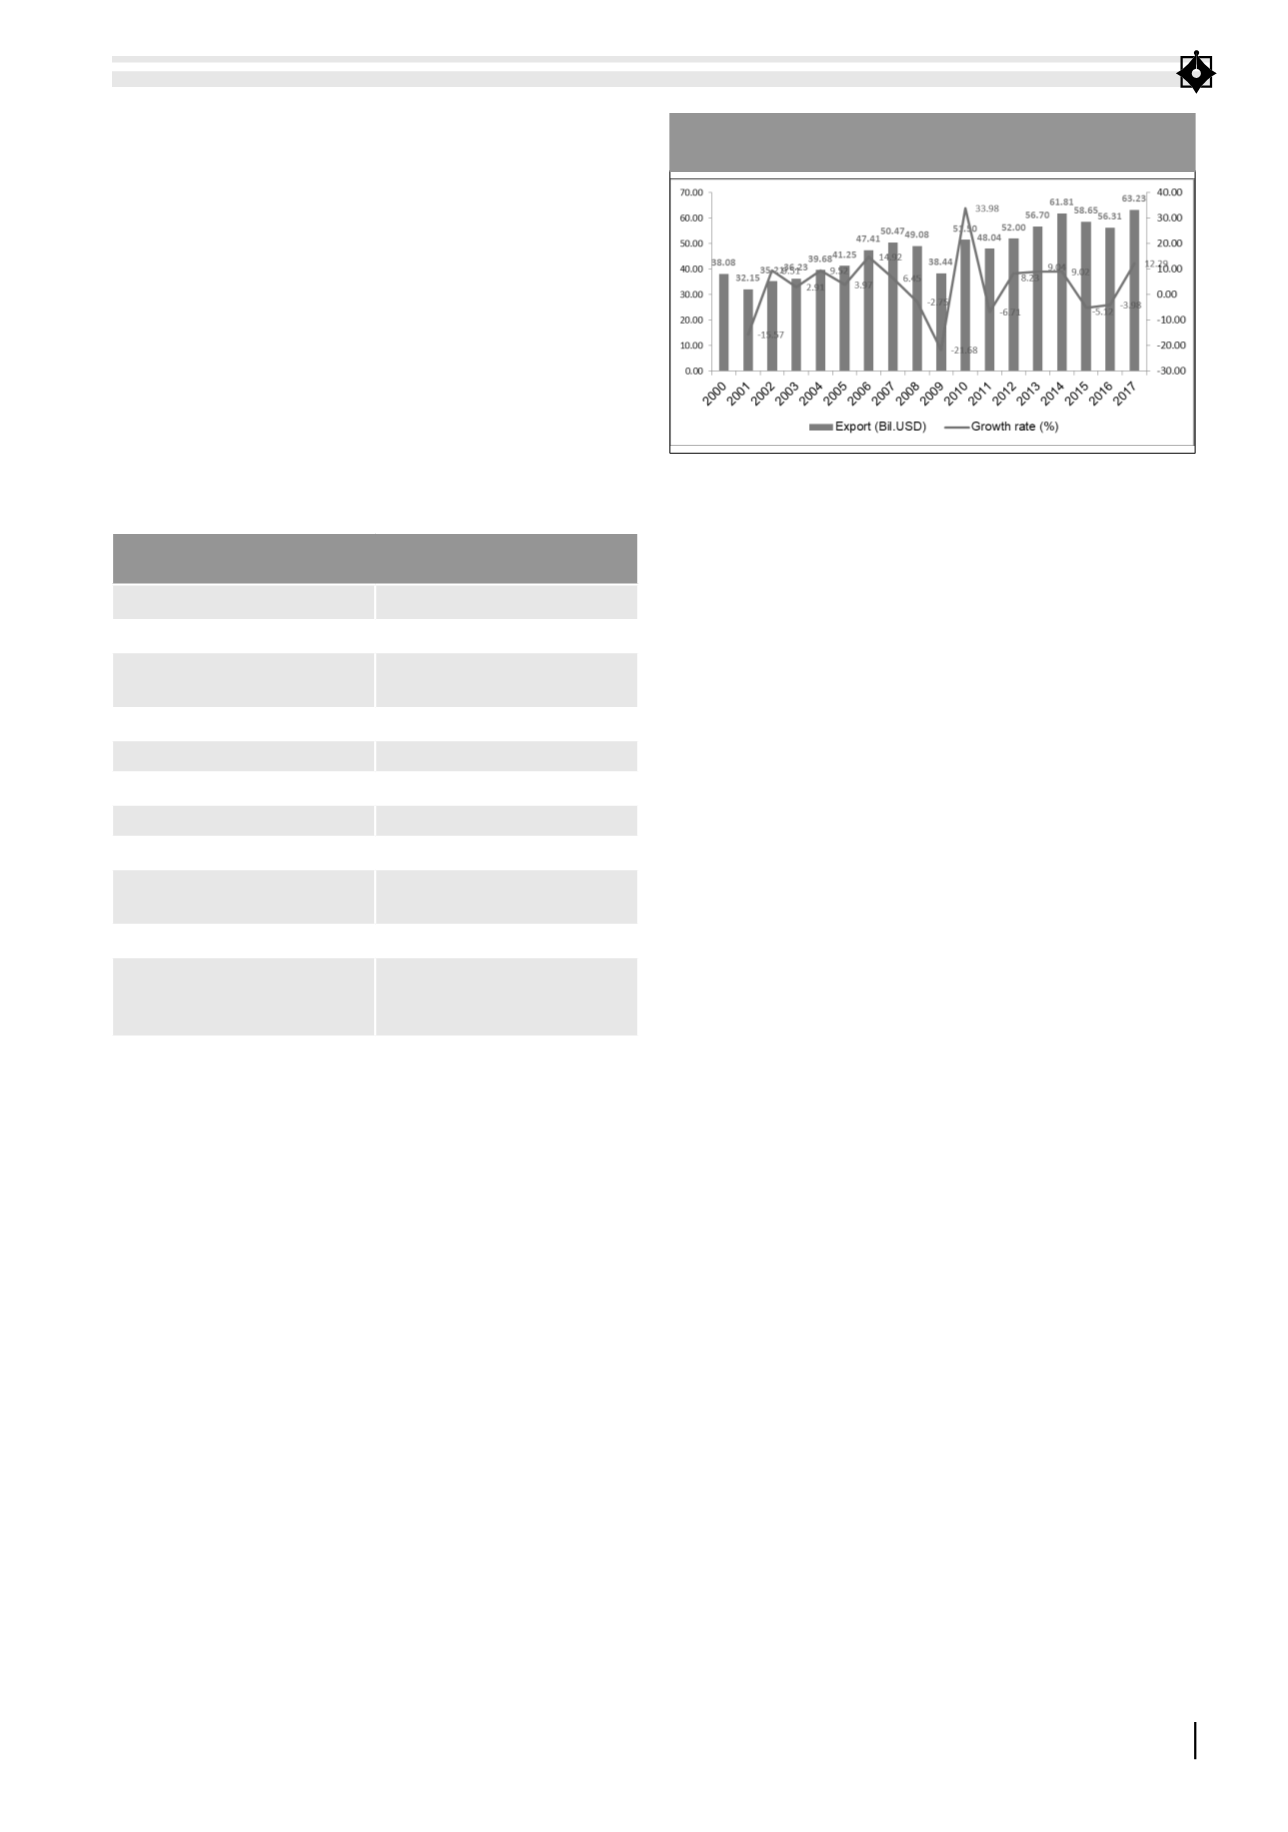
Export of the Philippines in the period 2000-
2017 has experienced encouraging results.
Despite certain years of recession, the export of
the Philippines is now accounting considerable
amount in economic growth (Figure 1)
As illustrated in the Figure 1, the export of the
Philippines varied complicatedly but still had an
average growth rate of 3.03%/year for the period
2000 – 2017. The results showed the effects of the
financial crisis (happened to ASEAN in 1998 – 2000)
which distressed export and GDP of the Philippines
in 2001. In 2002 – 2007, export activities of the
Philippines faced a positive recovery together with
national economy. In 2007, the Philippines’ export
reached50,465.71millionUSDwhichwas equivalent
toanincreaseof 43.3%incomparisontotheyear2002.
Meanwhile, the contribution to GDP of the export
was reduced sharply to 33.79%. The period 2008 –
2009, export of the Philippines went down again
with a decrease of 21.68% in 2009) as a result of the
global economic crisis causing a dramatic reduction
in GDP contribution (export contribution in GDP
was 22.83%). In 2010 – 2016, GDP was growing
meanwhile export was fluctuating as a result of the
changes in global demand and domestic supply.
In general, it is recognized that the proportion of
export in GDP of the Philippines tended to decrease
in the period 2000 – 2016.
Factors of the Philippines’ export activities
Regression results (Table 2) show that there is
67.95% of the change in export of the Philippines
determined by the factors of the model. Regression
model completely matters with Wald test value
of 591.96. GDP aggregate variable (GDPit*GDPjt)
has positive sign meaning the product of the
Philippines’ GDP and GDP of the import country
has positive impact on the export of the Philippines
with significance level less than 1%. This means that
(GDPit*GDPjt) increases by 1% will make the export
of the Philippines increase by 1.286%. Basically, this
result shows the relevane with given hypothesis
and results of previous studies. It can be explained
that when the economy is expanded, export country
like the Philippines will have more resources and
technology to invest in production and improve
productivity, as a result, the export is consequently
increased. For the import country, the economy scale
is expanded will make the demand of communities
increase and, thus, the import demand is increased
too. In the future, if this factor is promoted, the
Philippines’ exportwill be incrementedcontinuously.
FIGURE 1: THE PHILIPPINES’ EXPORT TURNOVER AND EXPORT
GROWTH RATE
Data source: Data extracted fromWorld Bank and calculation of the authors, 2018


