42
Methodology
Research Sampling
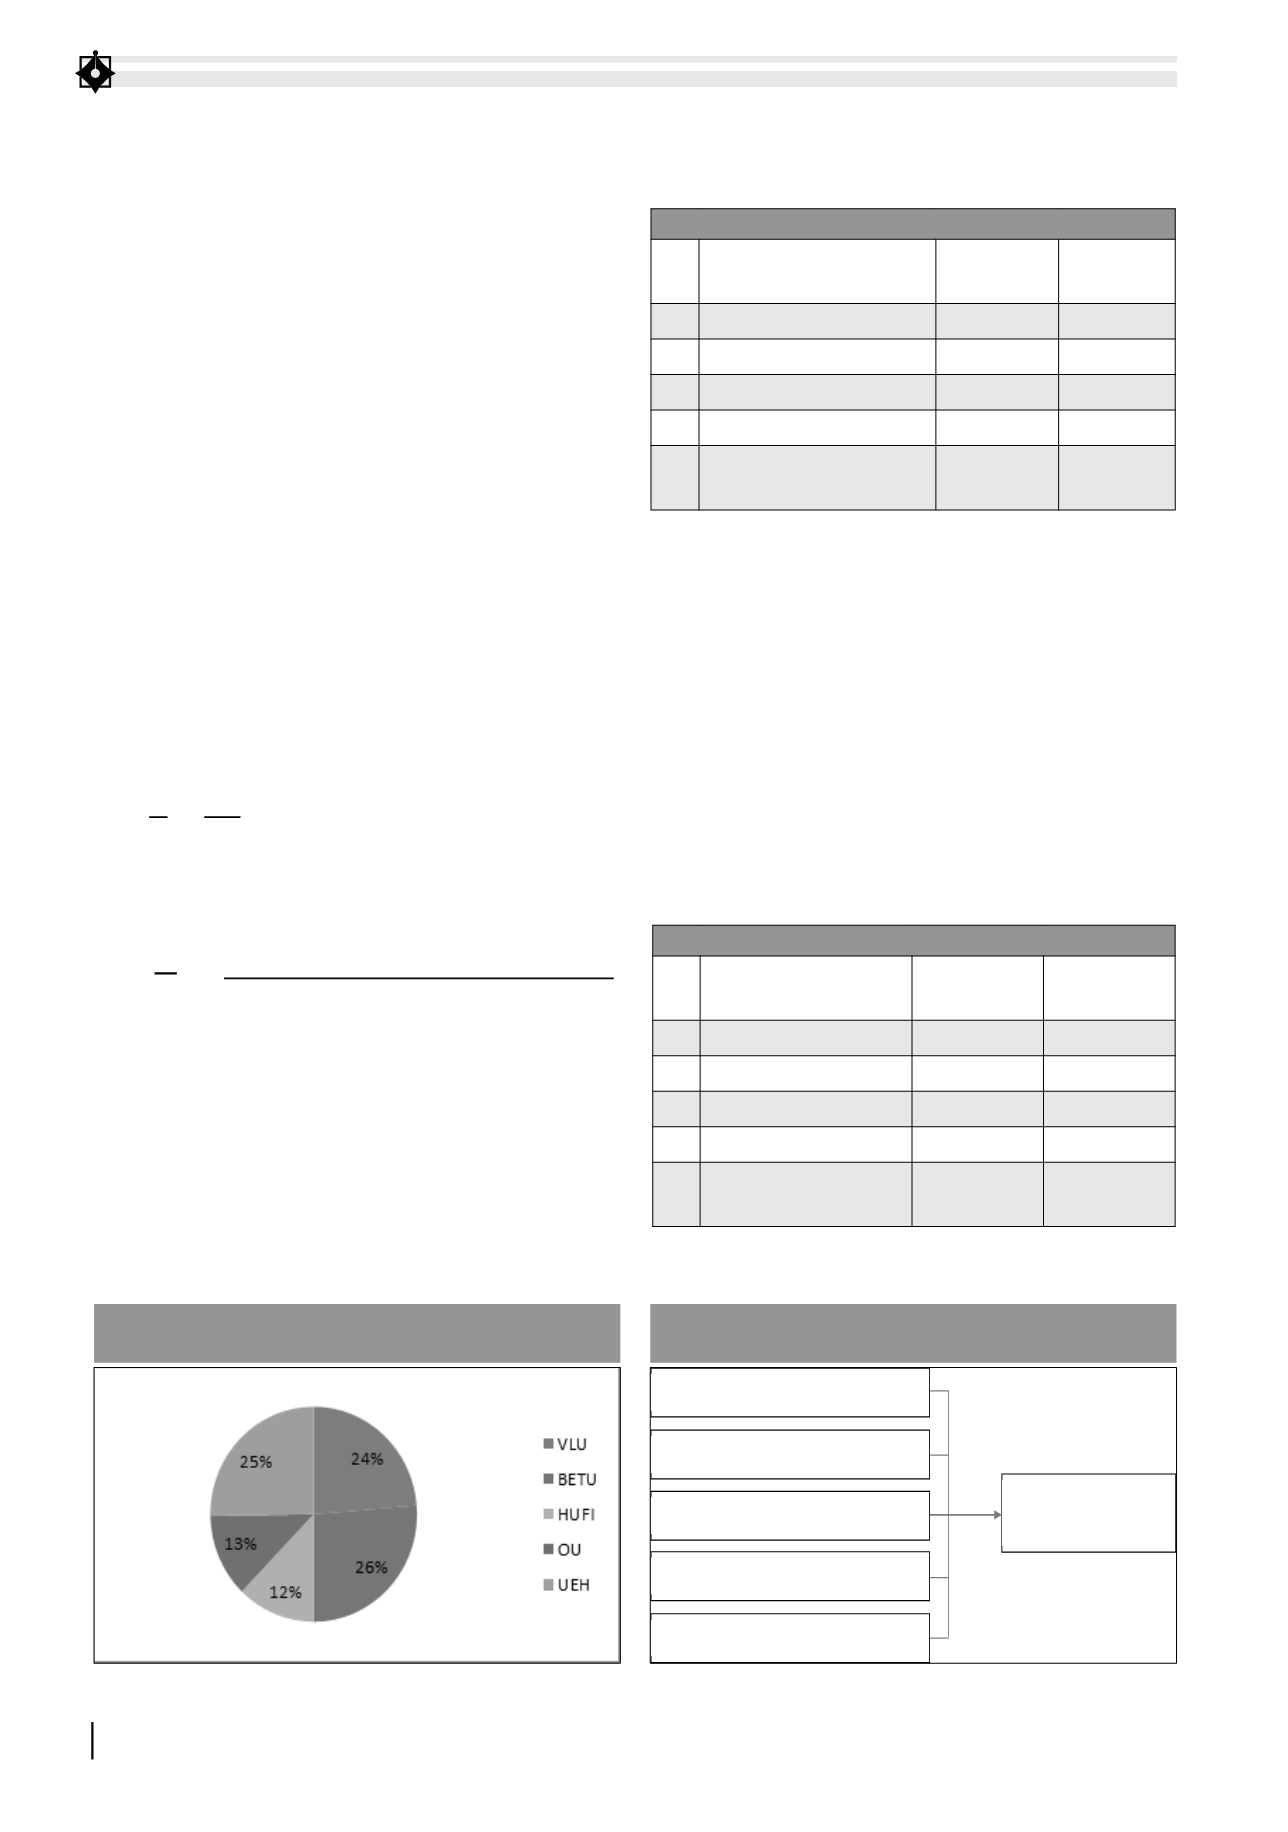
These data were collected on 376 higher schools
students from five universities in Hochiminh city
and Binh Duong province. The Decision variable
is a dichotomous variable coded “Yes” if choosing
Accouting as a major and “No” if not choosing.
Data Analysis Methods
To examine data for this study, five statistical
methods will be taken into consideration. They
include Descriptive Statistics, Reliability Analysis,
Exploratory Factor Analysis (EFA) and Binary
Logistic Regression Analysis. In particular, this
research will apply the Binary Logistic Regression
Analysis method to gauge the relation between
the variables. Hence regression model was
developed in order to determine the impact of the
independent variables on the dependent variable.
Linear regression predicts the value that Y takes.
E(
Y
X
i
) =
P
1−P
= e
(βo + β
1
X
1
+ β
2
X
2
+ … + β
i
X
i
)
Logistic regression predicts the probability of
Y taking a specific value (Xi).
=
݁
β0 + β1X1 + β1X2 + β1X3+ … + β1Xn)
1 + ݁
β0 + β1X1 + β1X2 + β1X3+ … + β1Xn)
P(
Y
X
i
)
P: probability of Y occuring
e: natural logarithm base
β0: interception at y-axis
β1: line gradient
βn: regression coefficient
X1, Xn: predictor variable
Xi: predicts the probability of Y at Xi
Results and Findings
Reliability Analysis
TABLE 1. RELIABILITY STATISTICS
N
Scale
No. of Items
accepted
Cronbach’s
Alpha
1
Personal characteristics
7
0.893
2
Job characteristics
7
0.900
3
University characteristics
5
0.883
4
Family member and Peers
5
0.882
5
Communication and
Labour demand
8
0.901
Source: Authors
Exploratory Factor Analysis
Factor analysis via Barllet’s Test showed
KMO=0.837, Sig=0.000, with the percentage of
variance being 64.624% so that this method was
fit to the data. The result showed that there are
5 accepted factors, as all of the variables had a
factor loading rate of above 0.6, proving that
they had high statistical power and significance
level.
TABLE 2. EXPORATORY FACTOR ANALYSIS
N
Scale
No. of Items
accepted
Factor
loading
1
Personal characteristics
7
0.700 - 0.810
2
Job characteristics
7
0.702 - 0.829
3
University characteristics
5
0.753 - 0.871
4
Family member and Peers
5
0.714 - 0.862
5
Communication and
Labour demand
8
0.699 - 0.795
Source: Authors
Personal characteristics (PC)
Job characteristics (JC)
University characteristics (UC)
Family members and Peers (FP)
Communication and labour demand (CD)
Choice of Accounting
as a major
FIGURE 2. RESEARCH FRAMEWORK
Source: Authors
FIGURE 1. DESCRIPTIVE STATISTICS OF RESEARCH SAMPLING
Source: Authors


